Identifying DESI Outliers
The spectra displayed on this webpage were identified as outliers using a specific method that is described in detail here. These outliers were detected during the observation night of 06th July 2021 (20210706). Here, you have the opportunity to inspect each spectrum individually and report any features that you identify as contributing to its classification as an outlier.
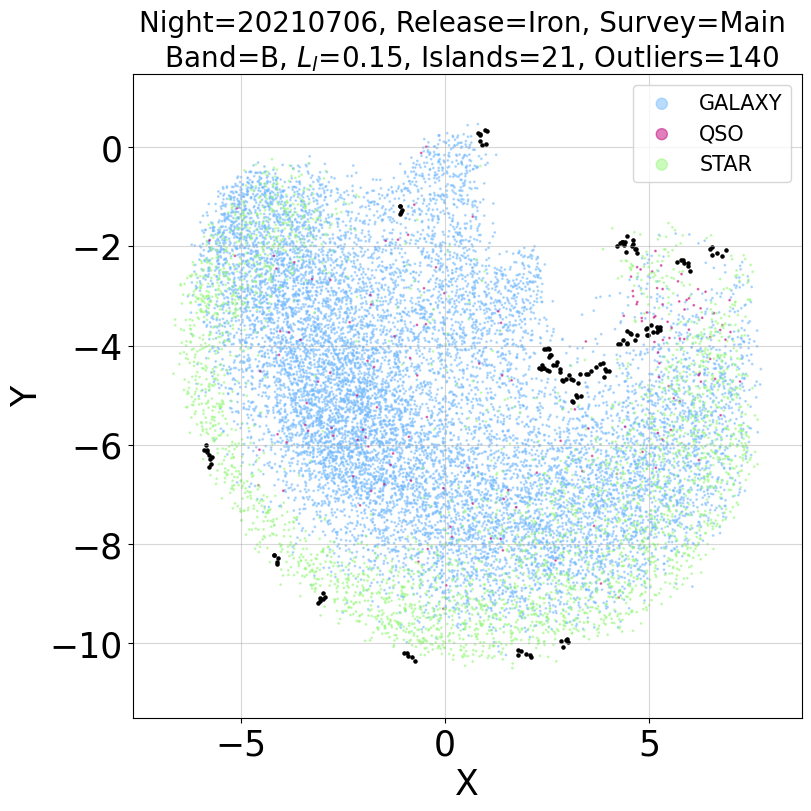
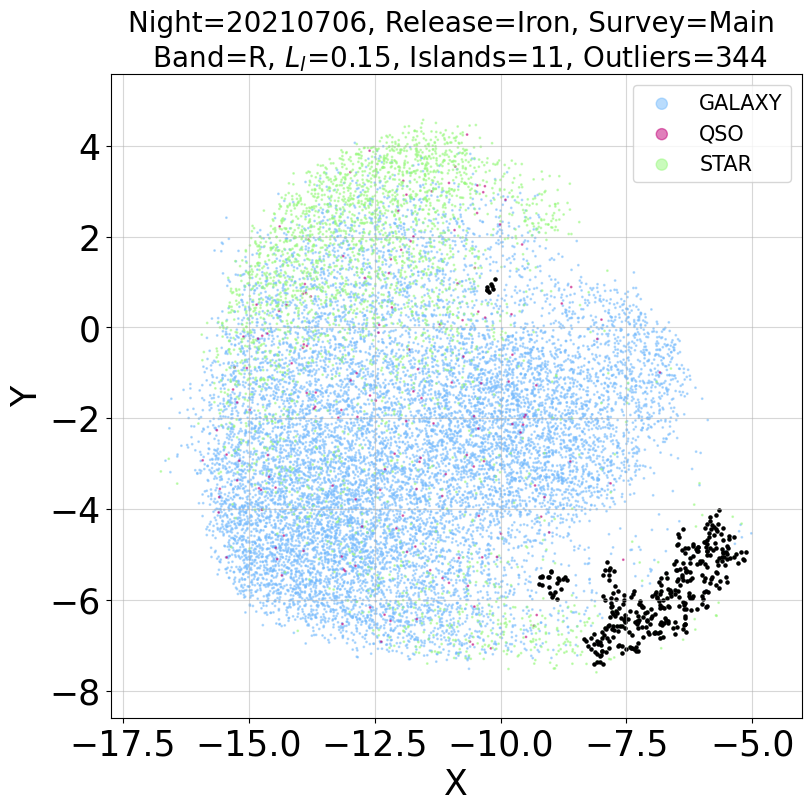
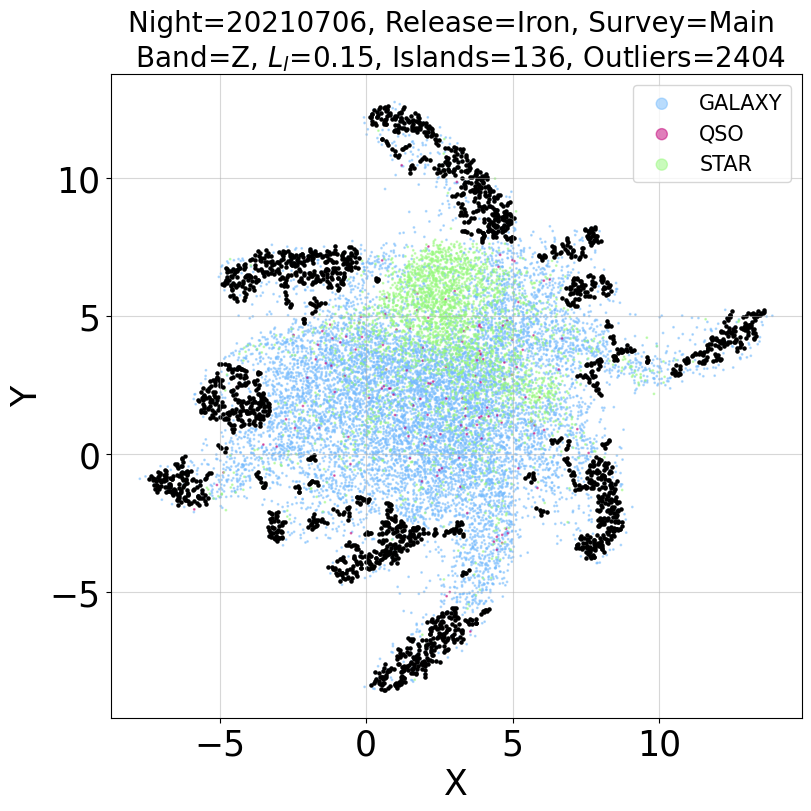
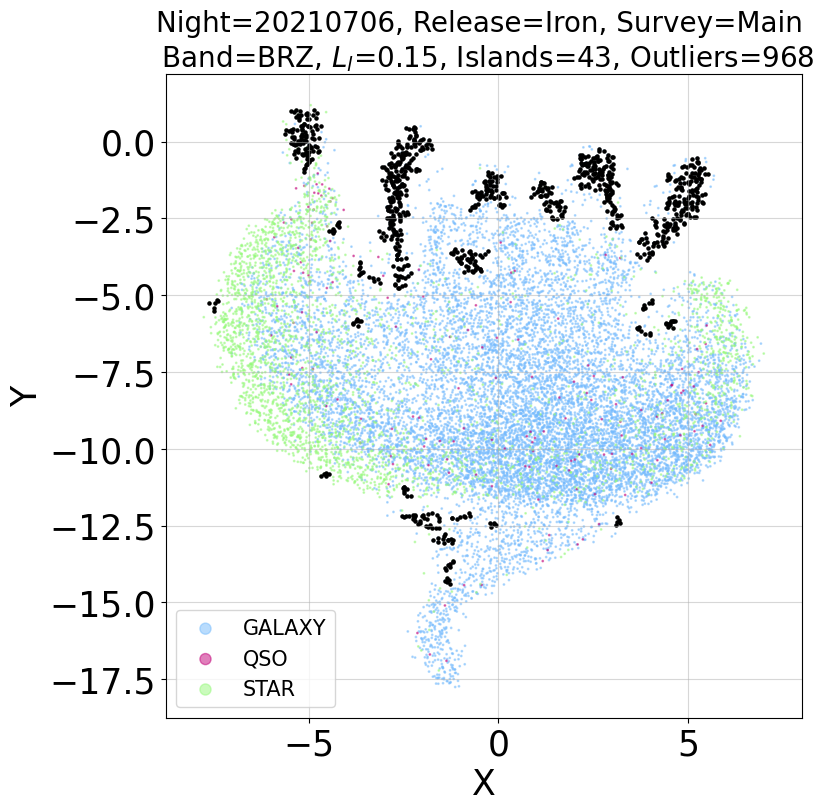
The Figures below show the UMAP projections of the observations in the B,R,Z and BRZ bands. The points highlighted in black are the outliers observations identified with the method.
Reporting abnormal features
Below, you will find a collection of spectra that have been identified as outliers by the method. To inspect a particular spectrum, simply click on its miniature image, and it will be zoomed in for closer examination. You can navigate between the spectra using the arrow buttons or the arrow keys on your keyboard. If you notice any particular features that you think might be important, please take a moment to report them to me by clicking on the “Report” button. This will allow you to send me a message detailing the feature(s) you have identified during your visual inspection, which can be invaluable for further analysis and research. Don’t hesitate to report anything you find interesting or unusual!